What Are Geographic Information Systems? A Complete Guide
Discover what are geographic information systems (GIS), how they work, and why they’re essential for turning location data into valuable insights. Learn more now!
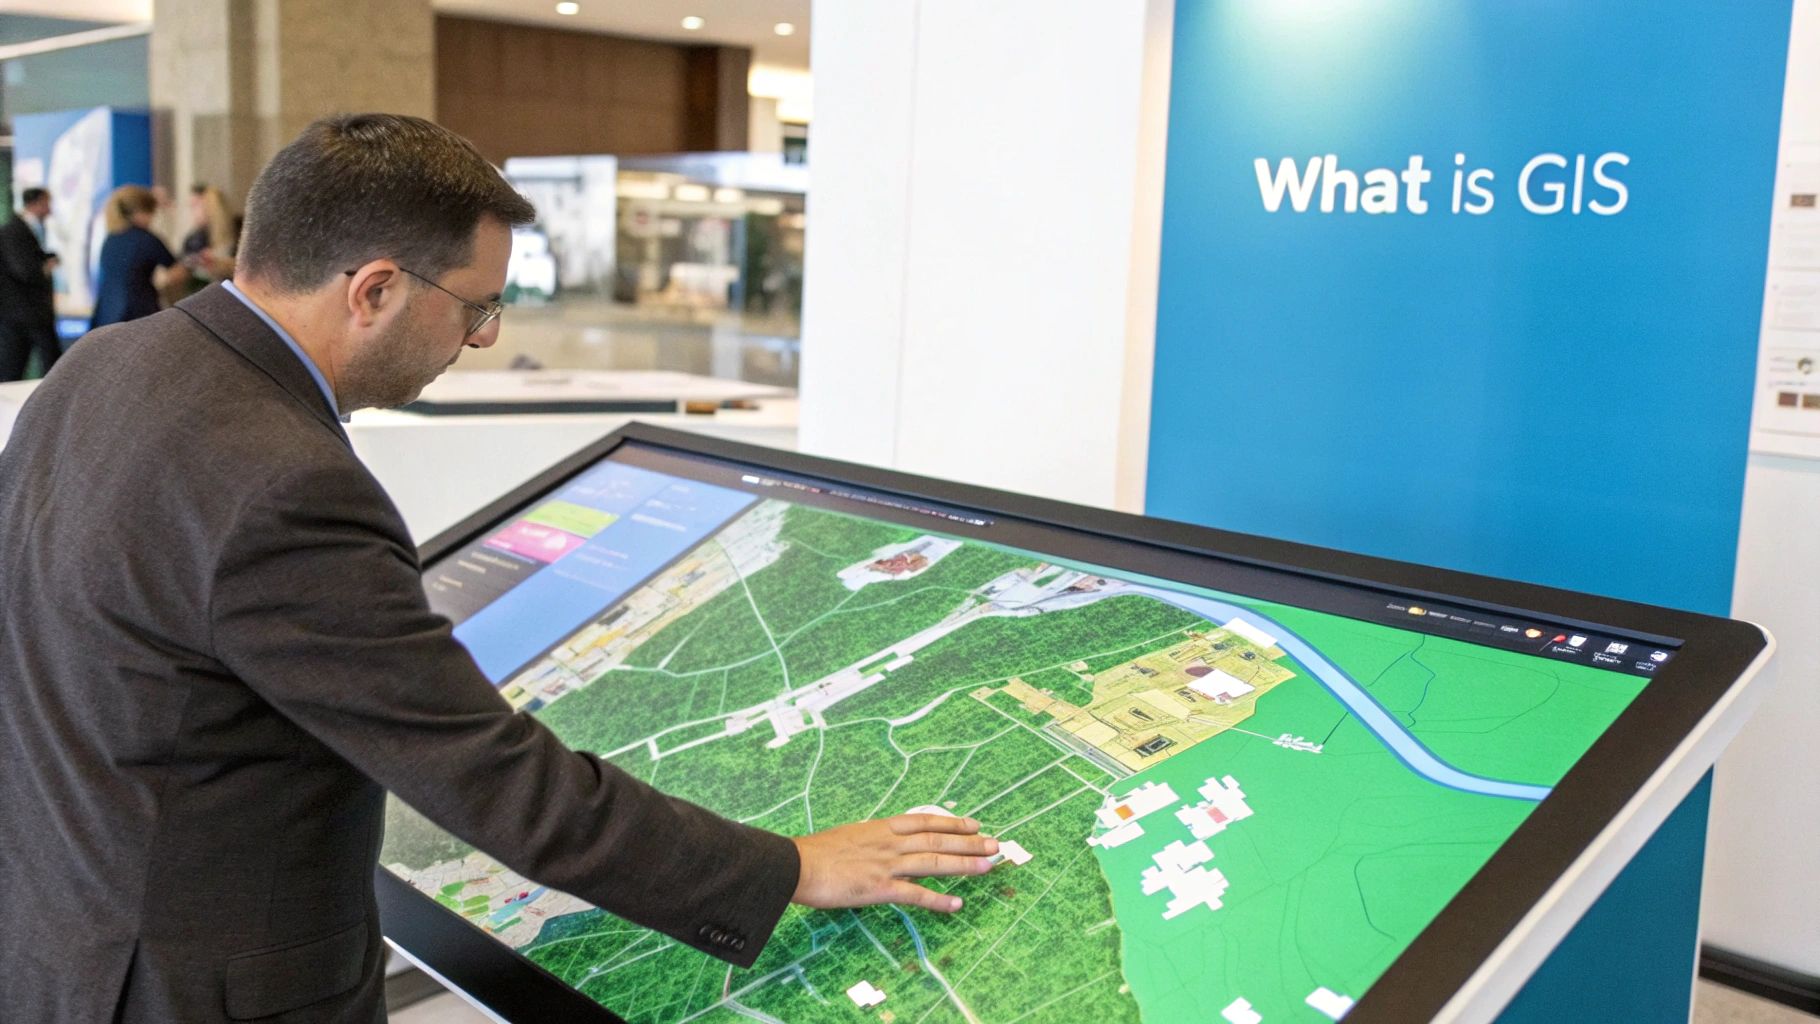
So, what exactly is a Geographic Information System (GIS)? The simplest way to think about it is as a smart map. But instead of being a single, static picture, a GIS is made of many digital layers stacked on top of each other.
This clever system is designed to capture, manage, and analyze data that's tied to a specific location on Earth. It lets you see, understand, and interpret that data in a way that reveals relationships, patterns, and trends that would be almost impossible to spot otherwise.
Understanding The Smart Map Concept
At its heart, GIS goes way beyond the traditional paper maps we're used to. It creates a living, breathing model of the world by combining totally different types of information into distinct, transparent layers.
Think of it like this: Imagine you have a clear sheet of plastic with just the roads of your city drawn on it. Now, place another clear sheet on top showing only the buildings. Then add another one with rivers, and a final one showing neighborhood boundaries.
When you look down through all those layers at once, you suddenly have a complete, multi-dimensional picture of your city. That’s the magic of GIS.
How Digital Layers Work
This layering concept is the absolute foundation of what a geographic information system is. Each individual layer holds a very specific type of data—like elevation, property lines, or foot traffic—all tied to a geographic location. This allows us to ask some seriously complex questions.
For instance, a city planner could overlay a population density layer with a road network layer to instantly see which neighborhoods are underserved by public transit.
To get a clearer picture, here’s a quick breakdown of the core concepts.
GIS At a Glance
The table below summarizes the fundamental ideas behind Geographic Information Systems in simple terms.
| Concept | Simple Explanation |
|---|---|
| Spatial Data | Information that is tied to a specific location on Earth. |
| Layers | Different types of data are organized into separate "sheets" on the map. |
| Attributes | Each feature on a map layer (like a road or building) has data attached to it. |
| Analysis | Using software to ask questions and find patterns in the layered data. |
| Visualization | Turning raw data and spreadsheets into an interactive, visual map. |
By combining these elements, GIS gives us a powerful new way to understand our world.
Powerful GIS software, like ArcGIS or the open-source QGIS, lets you do some amazing things:
- Visualize Data: It can turn a boring spreadsheet full of numbers into a vibrant, interactive map that just makes sense visually.
- Analyze Relationships: You can finally uncover hidden connections between different datasets, like the link between industrial pollution sources and public health problems in a community.
- Perform Queries: You can ask the map direct, location-based questions. Think: "Show me all the hospitals within a 10-mile radius of this major highway."
By integrating various data sources onto a single map, GIS transforms raw location information into a powerful tool for strategic decision-making and problem-solving across countless industries.
This unique ability to blend, question, and analyze spatial information is what makes GIS so indispensable today. It’s the very technology that powers your phone’s navigation app, helps emergency services find the fastest route to a crisis, and allows scientists to track environmental changes with incredible precision.
Ultimately, it turns simple location data into truly actionable intelligence.
The Five Building Blocks of Any GIS
To really get what a geographic information system is, think of it like baking a cake from scratch. You can't just throw flour in a bowl and call it a day. You need all the right ingredients, the right tools, and a solid recipe, all working together to get something delicious. A functional GIS is exactly the same—it relies on five essential building blocks that have to collaborate to turn raw location data into something truly insightful.
If you miss even one of these components, the whole system just doesn't work. It becomes little more than a fancy digital map collection, not the powerful analytical engine it’s meant to be.
This infographic breaks down the core components that create the foundation of any GIS.
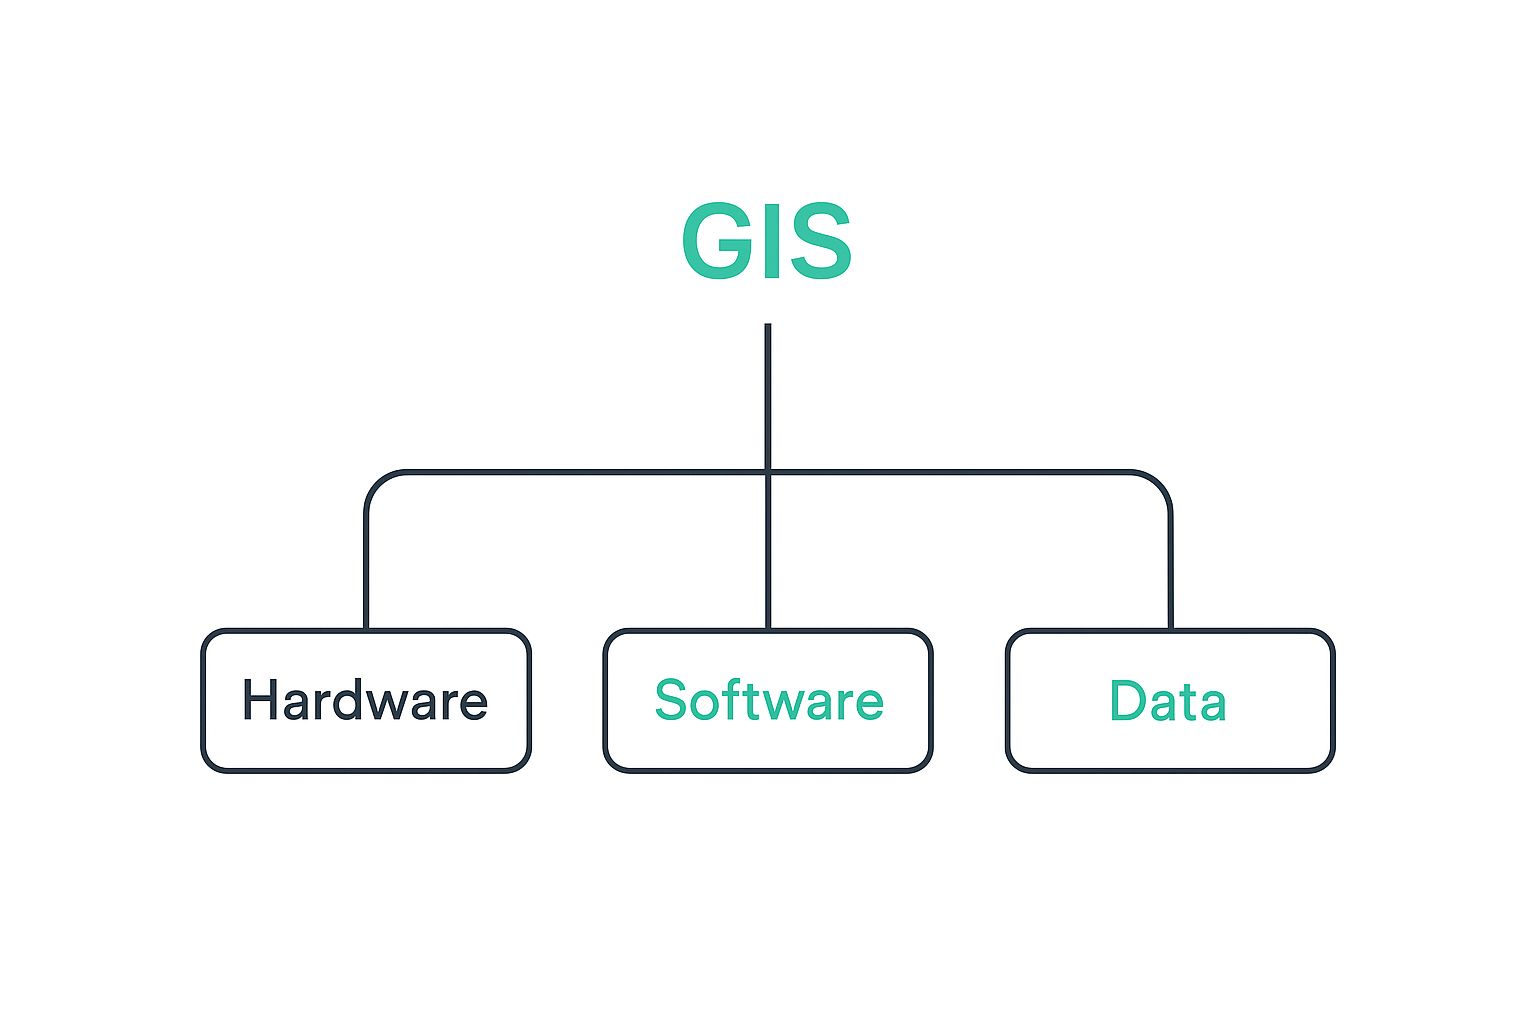
As you can see, the hardware, software, and data are the technical pillars holding everything up. But they don't do much on their own.
Hardware and Software: The Engine
First up, you need the actual machinery. Hardware is the physical foundation of the whole operation. This can be anything from a beast of a desktop computer or server crunching massive datasets to the mobile phone or GPS unit you use to collect information out in the world.
Next, you need the software, which is the brains behind the brawn. This is where programs like Esri's ArcGIS or the amazing open-source QGIS come in. They provide the toolset to input, manage, analyze, and, most importantly, visualize all that geographic data. It's the software that lets you ask the complex spatial questions.
Data: The Fuel
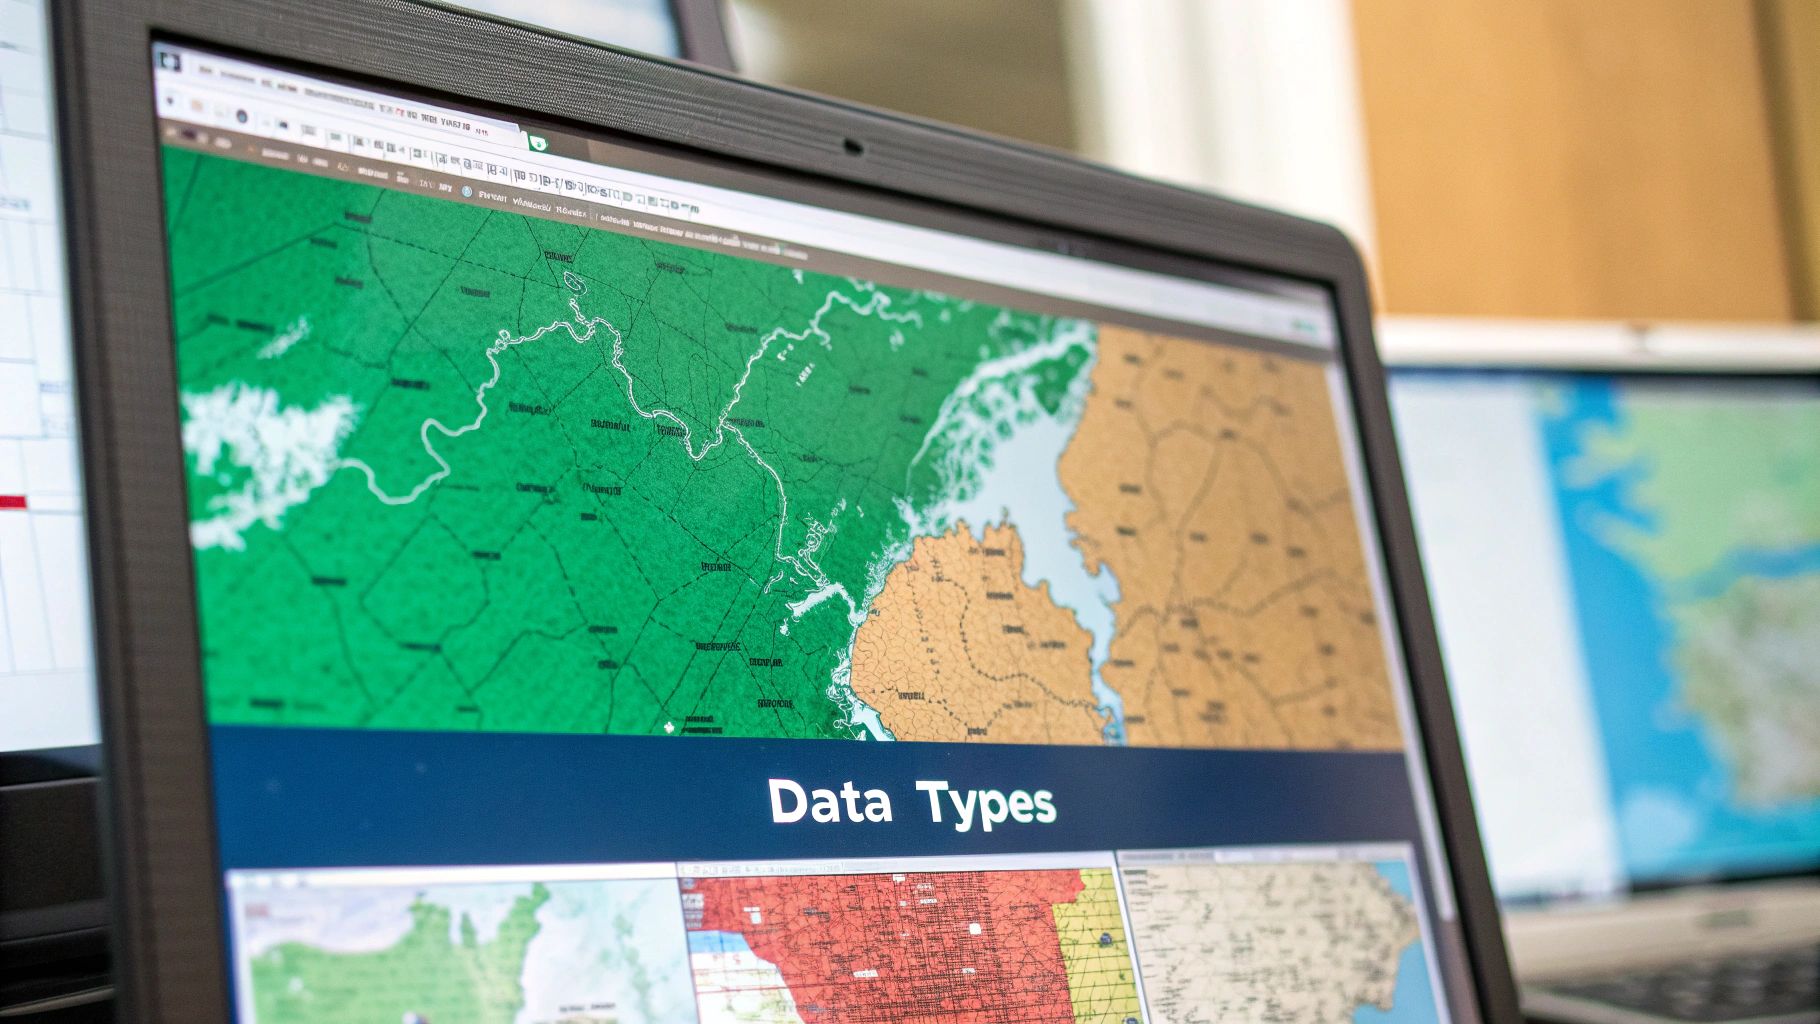
Data is, without a doubt, the most critical ingredient. A GIS without data is just an empty, expensive shell. This information generally falls into two main camps:
- Spatial Data: This is the geographic stuff itself—the coordinates of a skyscraper, the winding path of a river, or the exact boundary of a national park. This is the "where."
- Attribute Data: This is the descriptive info that's tied to the spatial features. For that skyscraper, the attributes might be its address, number of floors, and the year it was built. This is the "what."
Good, accurate data is the fuel for any meaningful analysis. Often, this means you'll need to convert data between different coordinate systems, a task made much easier with tools like a reliable coordinate converter.
A GIS is more than just technology; it's a framework for thinking. The combination of hardware, software, and data provides the tools, but it's the people and methods that drive real-world problem-solving.
People and Methods: The Strategy
Even with the best tech in the world, you need someone who knows how to use it. People are the human element—the trained analysts, technicians, and managers who design and operate the system. They’re the ones asking the right questions, interpreting the results, and making smart decisions based on what the data reveals.
Finally, you have methods. These are the structured workflows and scientific processes that guide the analysis. A well-defined plan ensures your results are accurate, repeatable, and valid. Think of it as the recipe that brings all the other components together successfully.
This growing need for skilled professionals is a big reason why the global GIS market is projected to skyrocket to USD 32.04 billion by 2033, up from USD 12.90 billion in 2024. As detailed in recent market growth analyses, this massive growth is fueled by GIS becoming essential in everything from smart city planning to modern agriculture.
How GIS Turns Data Into Decisions
So, how does a geographic information system actually work its magic? It's a powerful two-step dance: first, it captures information about the world, and second, it asks that data intelligent, location-based questions.
This process transforms raw facts into a powerful tool for making smarter choices, turning a simple map into a dynamic decision-making machine.
Capturing the World as Data
The journey begins with data capture. Think of this as GIS gathering all its ingredients before it can start cooking. It's all about collecting information from a huge variety of sources and converting the physical world into digital map layers a computer can understand.
This data can come from just about anywhere:
- Satellite Imagery: High-resolution pictures from space show us everything from urban growth to shrinking forests.
- Drone Photography: Drones give us incredibly detailed, up-to-the-minute views of smaller areas, perfect for monitoring a construction site or analyzing crop health.
- Field Surveys: Teams on the ground use GPS units to record the precise locations of things like fire hydrants, property lines, or hiking trails.
- Existing Databases: This is your classic tabular data—think census information, customer addresses, or public health statistics.
Each piece of data is digitized and organized into its own thematic layer. You'll have one layer for roads, another for buildings, one for elevation, and so on. But just having these separate layers is only the start. The real power comes when you make them talk to each other.
The Art of Spatial Analysis
With the data captured and layered, the exciting part begins: spatial analysis. This is the absolute core of what a geographic information system is. It’s the process of asking complex questions by analyzing the relationships between different data layers.
Let's say a retail company wants to find the perfect location for a new coffee shop. Just looking at a list of available properties won't cut it. With GIS, they can perform a multi-layered analysis to pinpoint the ideal spot.
GIS doesn't just show you where things are. It reveals why they are there and helps predict what could happen next. It connects seemingly unrelated data points to uncover patterns that are invisible to the naked eye.
Here's how they'd do it. They would start by creating several data layers on a map of the city:
- A layer of all competitor coffee shops. This instantly shows which areas are already saturated.
- A layer of demographic data. They could filter for neighborhoods with a high concentration of their target audience, like young professionals aged 25-40.
- A layer of traffic patterns. This reveals which streets get the most foot and vehicle traffic during the morning commute.
- A layer showing office buildings and public transit stops. These are magnets for potential customers who need their caffeine fix.
By overlaying these digital maps, the company can ask the GIS a very specific question: "Show me all available properties that are not within 500 meters of a competitor, are in a neighborhood packed with our target demographic, and are located on a street with high morning foot traffic."
The GIS crunches all these layers at once and highlights a handful of optimal locations that meet every single criterion. That's how raw data—like competitor addresses, population stats, and traffic counts—is transformed into a confident, data-driven business decision.
This powerful process of layering and questioning is what turns a map into an indispensable analytical tool, whether you're building a business or just exploring the world. For anyone who enjoys creating their own visual stories, a custom map creator is a fantastic way to experiment with layering different types of geographic information.
Putting GIS to Work in the Real World
Far from some dusty academic concept, GIS is shaping our world every single day, often in ways you’d never expect. Its real power comes from layering and analyzing location-based data, which turns it into an incredible problem-solver for dozens of industries. This is where the theory hits the road, offering real answers to real challenges—from getting packages delivered faster to protecting entire ecosystems.
And that impact is driving some serious growth. The global market for Geographic Information Systems was pegged at around USD 14.4 billion in 2024, and it's projected to rocket to USD 37.1 billion by 2033. This boom, detailed in this market analysis, shows just how vital GIS has become for everything from city planning to farming.
Let's dive into a few examples of GIS in action.
Crafting Smarter Cities
Urban planners live and breathe GIS, and for good reason. They use it as a digital sandbox to design, tweak, and manage the incredibly complex systems that keep a city running.
Think about a city planning team trying to add a new bus route. Using GIS, they can stack several critical data layers on top of one another:
- Population Density: Pinpointing exactly where the most people live.
- Income Levels: Showing which neighborhoods rely most on public transit.
- Existing Transit Stops: Revealing gaps in the current network.
- Major Employers and Destinations: Mapping where people actually need to go.
By seeing all these layers at once, planners can draw a new route that serves the most people, connects underserved communities, and cuts down on commute times. It’s a data-first approach that helps build smarter, more equitable cities.
This screenshot from Esri, a leader in GIS software, gives you a glimpse of just how many fields rely on this tech.
As you can see, it’s not a niche tool—it's a foundational technology for government, business, and conservation.
Protecting Our Natural World
Environmental scientists lean heavily on GIS to keep a finger on the pulse of our planet. When tracking wildfire risk, for instance, analysts combine data on vegetation, moisture levels, weather patterns, and past fire hotspots. This creates a predictive map showing which areas are most vulnerable, letting authorities issue warnings and get resources in place before disaster strikes.
GIS is also essential for:
- Tracking Deforestation: Satellite images analyzed in a GIS can measure the rate of forest loss in places like the Amazon with incredible precision.
- Monitoring Wildlife: Researchers map animal migration routes to design wildlife corridors that keep habitats connected.
- Analyzing Pollution: By mapping industrial sites against waterway data, scientists can trace pollution right back to its source.
Of course, understanding the lay of the land—the terrain itself—is a huge part of this. To get a feel for how vertical data is tied to geography, play around with an online elevation finder tool and see how height changes with every coordinate.
Optimizing Business and Logistics
In the world of commerce, efficiency is king. Logistics giants like FedEx and UPS use incredibly advanced GIS systems to map out their delivery routes every single day. The system juggles thousands of addresses, live traffic conditions, and delivery windows to find the absolute best path for every driver.
GIS transforms how businesses operate by answering the simple but powerful question of "where?" By visualizing customers, supply chains, and market trends on a map, companies make smarter, faster, and more profitable decisions.
This saves millions in fuel, slashes emissions, and gets your packages to you on time. In the same way, retailers use GIS to analyze demographics and competitor locations to find the perfect spot for their next store—just like we talked about earlier.
From emergency services cutting down response times to farmers using precision agriculture to grow more food with fewer resources, the applications are practically endless.
The Future of Location Intelligence
The world of Geographic Information Systems is moving at a breakneck pace. It's no longer just about mapping what is—it's about predicting what will be. Fueled by a flood of new tech, GIS is evolving from a simple analysis tool into the predictive powerhouse for our hyper-connected world.
This isn't just a niche trend; it's a massive economic shift. The GIS market, valued at USD 13.92 billion in 2024, is on track to hit USD 31.32 billion by 2032. That's a compound annual growth rate of nearly 10.7%, driven by the very innovations we're about to cover. For a closer look at the numbers, you can dive into the GIS market forecast from 360iResearch.
The Rise of GeoAI and Machine Learning
The biggest leap forward is the fusion of GIS with Artificial Intelligence, a combination now known as GeoAI. Instead of analysts spending hours hunting for patterns, machine learning algorithms can now chew through colossal spatial datasets, spotting subtle connections and forecasting trends all on their own.
Think about a city trying to get ahead of rush-hour gridlock. A GeoAI model can analyze years of traffic data, weather patterns, concert schedules, and even social media chatter to flag future hotspots hours before they happen. This means proactive traffic management, not just reacting to a mess that's already there.
A World of Real-Time Data
Another game-changer is the Internet of Things (IoT). Our world is now blanketed with billions of connected sensors—on cars, streetlights, soil monitors, and shipping containers. Each one is a tiny geolocated data firehose, streaming live information 24/7.
This torrent of data transforms GIS from a static snapshot into a living, breathing model of the world. The impact is huge:
- Dynamic Urban Planning: Cities can monitor air quality, traffic, and power usage in real-time, tweaking services on the fly to meet demand.
- Precision Agriculture: Farmers get live updates from soil sensors and drones, letting them apply water or fertilizer exactly where needed, which boosts yields and slashes waste.
- Smarter Logistics: Delivery companies can track their entire fleet second by second, rerouting drivers around accidents or traffic jams instantly.
The future of GIS is dynamic and predictive. By integrating real-time data from IoT and the analytical power of AI, we are creating systems that can not only understand the present but also anticipate and shape the future.
Cloud Computing and Accessibility
Finally, the shift to cloud-based GIS platforms is putting this incredible technology into everyone's hands. You no longer need a server farm in your basement to run complex spatial analyses. Now, anyone with a web browser can access powerful tools and enormous datasets.
This "democratization" of GIS is kicking off a wave of innovation. It empowers small businesses, non-profits, and even individuals to use location intelligence to solve problems. From the navigation systems in self-driving cars to the planning of resilient smart cities, what a geographic information system can do is just getting started.
Common GIS Questions Answered
As you start digging into geographic information systems, a few questions tend to bubble up right away. Nailing down the answers is the key to really grasping the GIS world, especially when you're trying to figure out how it differs from other tech you already know.
Let's clear the air on some of the most common points of curiosity.
What Is the Difference Between GIS and GPS?
It's super common to hear these two terms used interchangeably, but they are worlds apart. Here's a simple way to think about it: GPS (Global Positioning System) is the technology that finds your exact spot on the planet—it’s the little blue dot on your phone's map.
GIS (Geographic Information System), on the other hand, is the entire brain behind the map. It takes that blue dot and analyzes its relationship to everything else around it. GPS gives you a coordinate; GIS uses that coordinate along with dozens of other data layers—like property lines, flood zones, or foot traffic patterns—to solve complex problems.
Simply put: GPS finds a location; GIS helps you understand it.
Think of a GPS receiver as just one source of information for a GIS, like a satellite photo or a population census. The GIS is the workbench where all that information is brought together to build a complete, interactive picture of the world.
Is GIS a Good Career Path?
Without a doubt. In a world where data drives nearly every major decision, people who can analyze and interpret location-based information are in red-hot demand. A career in GIS isn't just for map-makers anymore; it's a critical skill in urban planning, environmental science, logistics, and even public health.
These skills are highly sought after by government agencies, private companies, and non-profits alike. With the rise of smart cities, renewable energy projects, and the endless need to optimize supply chains, the field is set for strong growth. You'll see job titles like GIS Analyst, Cartographer, Geospatial Developer, and City Planner.
Can I Learn GIS on My Own?
Yes, absolutely—and it's never been easier to get started. There’s a treasure trove of high-quality resources out there for self-starters. You can download powerful open-source software like QGIS for free and tap into a massive global community that produces fantastic tutorials and guides.
Even the industry titan, Esri, offers free web courses, detailed walkthroughs, and trial versions of its flagship ArcGIS software. The best way to learn is by doing. Pick a personal project that interests you, like mapping out the best bike routes in your town or analyzing local election data. You'll build real, hands-on skills that look great on a portfolio.
What Is the Most Common GIS Software?
In the professional world, the heavyweight champion is Esri's ArcGIS Pro. It's a massive suite of tools that has become the standard in most corporate, government, and academic environments.
But hot on its heels is QGIS, an incredibly powerful open-source alternative that costs nothing to use. Its capabilities are staggering and can go toe-to-toe with many paid programs, all while being supported by a passionate community. For web-based mapping and massive environmental analysis, platforms like CARTO and Google Earth Engine are also very popular. The "best" software really just depends on your specific goals and budget.
At EarthChasers, we believe that understanding our world should be an adventure. Our 3D geography game transforms learning into an exciting quest, letting you explore the planet's most amazing places right from your screen. Discover new cultures, tackle challenges, and see geography in a whole new light. Start your global adventure with EarthChasers today!